
COLUMN
Self-Hosting Next.js? You Just Inherited Its Observability
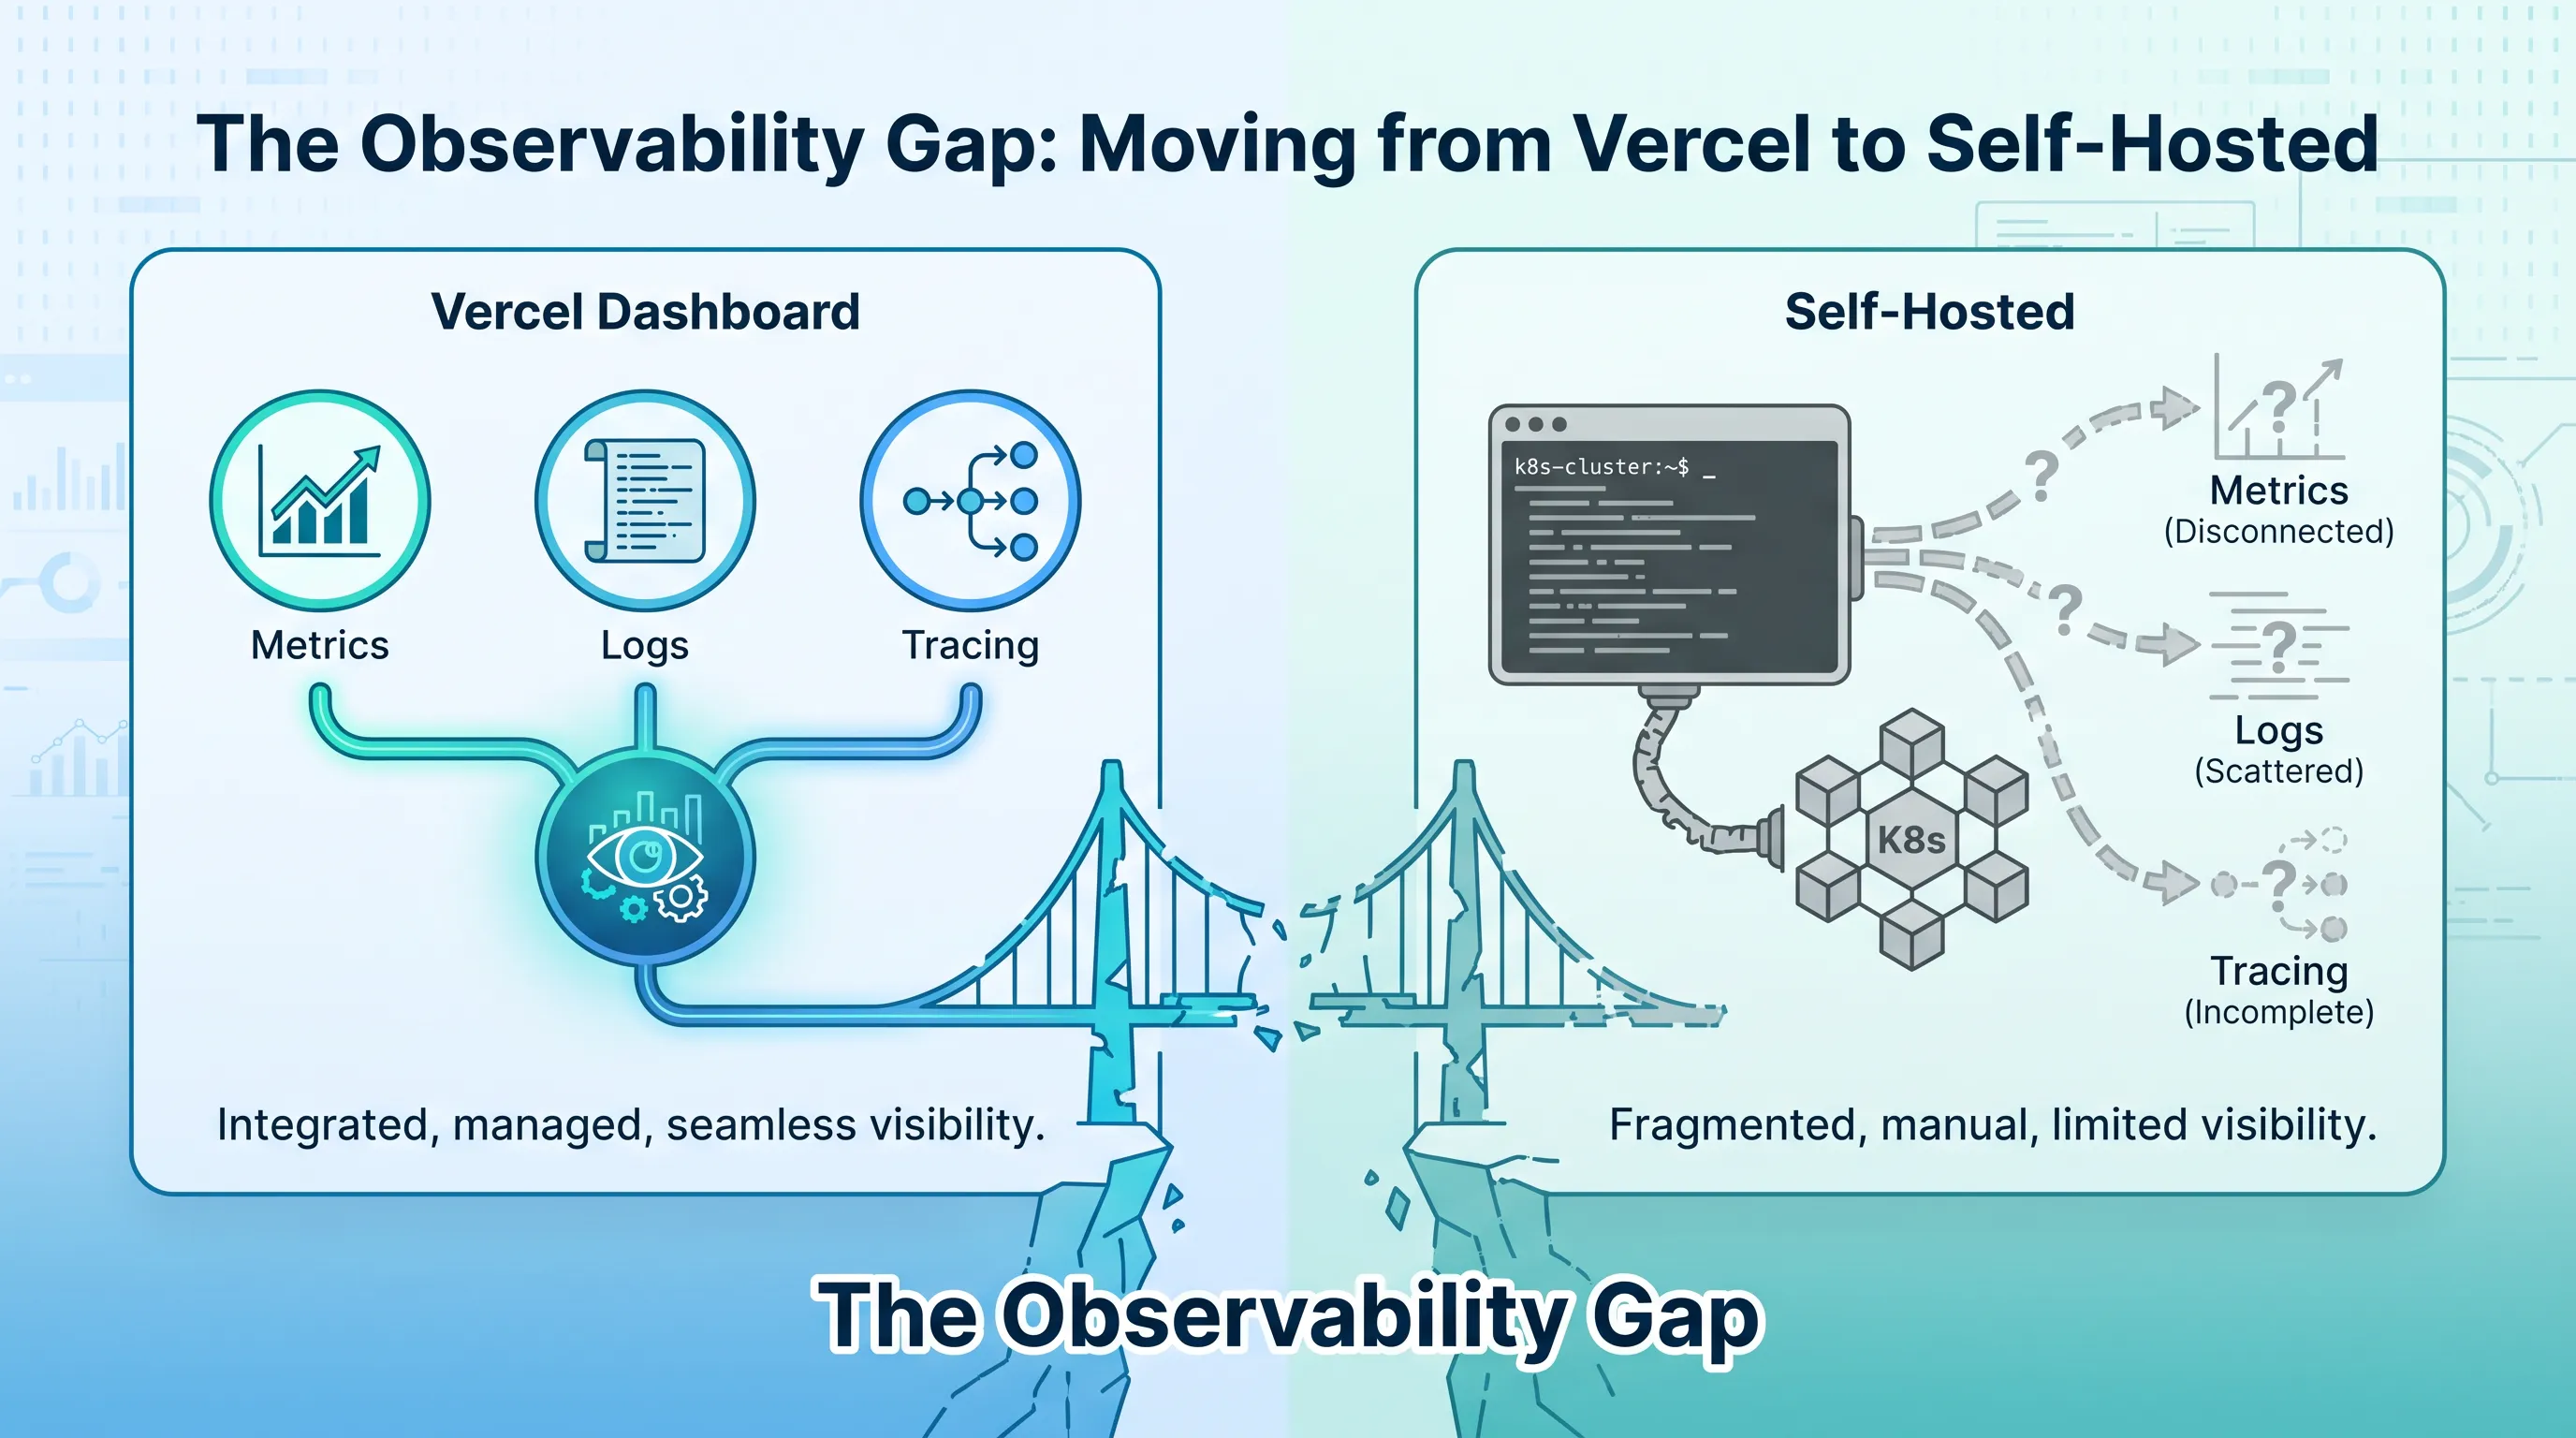
Vercel's dashboard quietly did a lot of work — request tracing, error alerts, cold-start metrics — that disappears the moment you self-host. Teams usually notice this in the worst possible moment: a production incident, three services deep, with nothing but console.log and a hunch.
If you've already moved your Next.js app off Vercel, or you're about to, this is the part that doesn't show up in migration checklists. Getting the app to build and run somewhere else is the easy 80%. Watching it once it's running is the 20% that Vercel used to hand you for free.
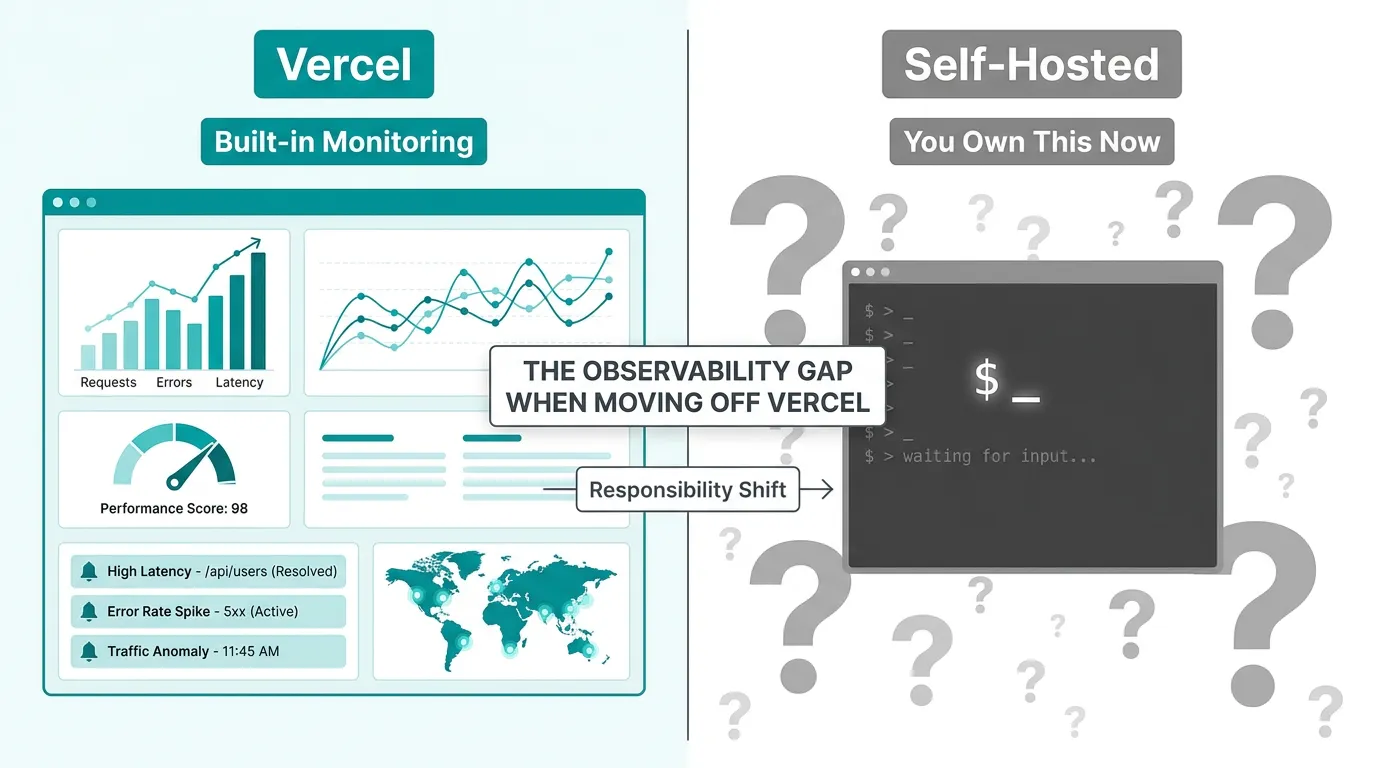
What Vercel Was Actually Doing For You
Vercel bundles several operational concerns into its platform that most teams never have to think about individually:
- Request-level tracing — every function invocation gets a trace, correlated automatically across your app
- Runtime logs — stdout/stderr from every deployment, searchable, retained for a fixed window
- Error monitoring — unhandled exceptions surfaced with stack traces and request context
- Infrastructure metrics — cold starts, function duration, memory usage per route
None of these are Next.js features. They're platform features that happen to sit next to your Next.js app. When you self-host — on a VM, a container platform, or Kubernetes — none of them come with you. You have to decide, deliberately, what replaces each one.
The Three Things You Now Own
1. Metrics and Alerting
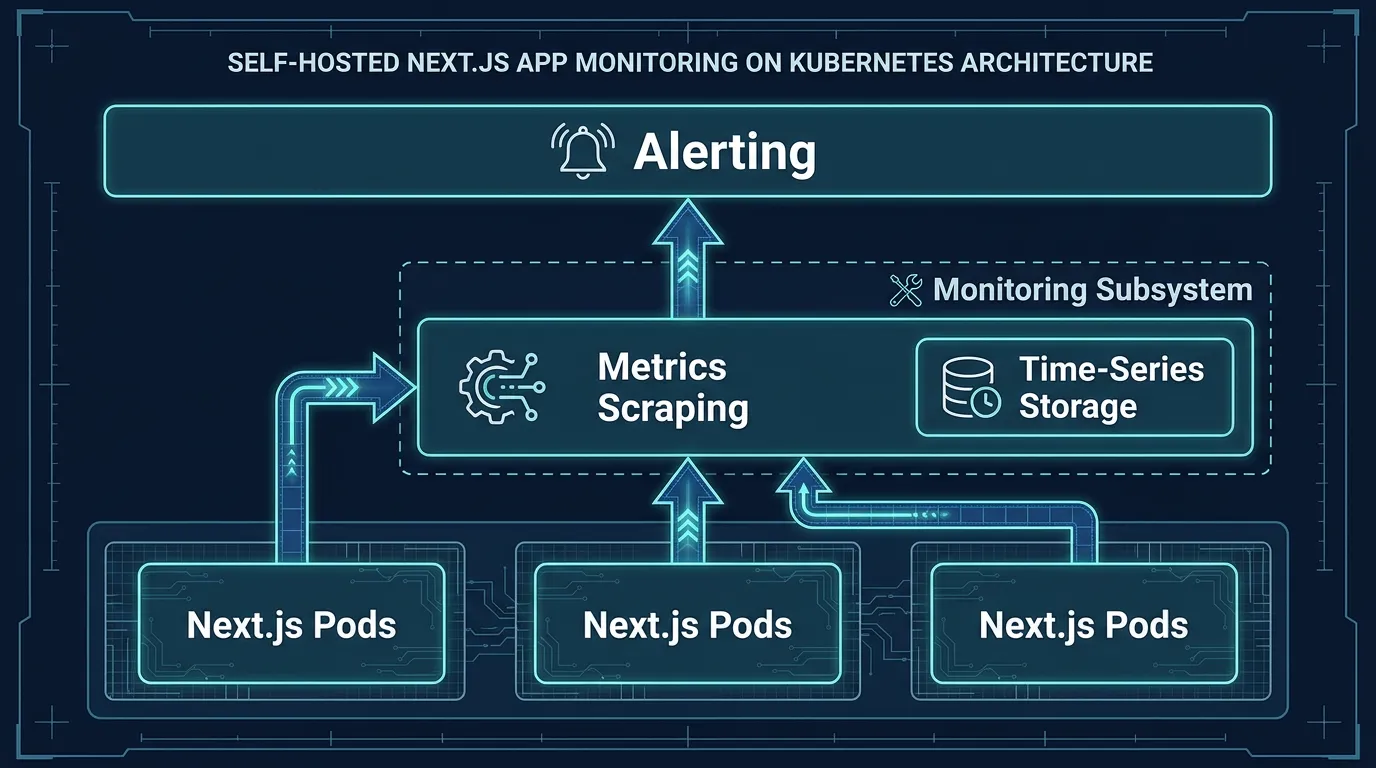
Without Vercel's dashboard, you need something watching CPU, memory, request latency, and error rate across every instance of your app. For a containerized Next.js deployment, Prometheus is the de facto standard: it scrapes metrics from your pods on an interval and stores them as time series, which you can then alert on and graph.
The setup itself is the part that catches teams off guard — service discovery, scrape configs, retention policies, and an Alertmanager instance that doesn't page anyone at 3 a.m. for a single failed health check. If you're standing this up on Kubernetes for the first time, this guide to setting up Prometheus monitoring walks through the pieces you'd otherwise have to assemble from separate docs.
Logs are the part teams tend to underestimate the most, mostly because they're the easiest to postpone. On Vercel, stdout/stderr from every deployment was already searchable. Self-hosted, if you don't ship logs somewhere central, "checking the logs" during an incident means shelling into whichever pod happens to still be running — and Kubernetes will happily kill and replace that pod before you get there. A log aggregator (Loki, or the ELK/OpenSearch stack) needs to exist before the first incident, not during it.
What makes this genuinely different from a single-server deployment is scale and churn: a Next.js app running across several replicas, restarted by the scheduler whenever it wants, means the useful unit of debugging is no longer "the server" — it's "the request," traced across whichever pods happened to handle it. That reframing is what the next two sections are really about.
2. Distributed Tracing
Vercel's function-level traces are convenient because a Next.js app is rarely just Next.js — it calls a database, an auth provider, maybe a payments API. When a page is slow, the trace tells you which hop was slow. Self-hosted, you lose that correlation unless you build it back in.
OpenTelemetry is the practical answer here: it's vendor-neutral, Next.js has built-in instrumentation support via instrumentation.ts, and it exports to whatever backend you choose. The harder part is wiring spans across service boundaries so a single request tells one coherent story instead of five disconnected ones — this walkthrough on distributed tracing across services covers the collector and exporter setup most teams skip until they need it under pressure.
In practice, this is usually a two-step rollout, not a one-time setup. First you instrument the Next.js app itself, so route handlers and server components emit spans. Then you propagate trace context to whatever your app calls next — a database, an internal API, a queue — so those spans nest under the same trace instead of starting a new one. Skip the second step and you'll have tracing that looks complete in a demo but goes dark exactly where a real incident starts: at the boundary between your app and everything downstream of it.
3. Networking Decisions You Didn't Know You Were Making
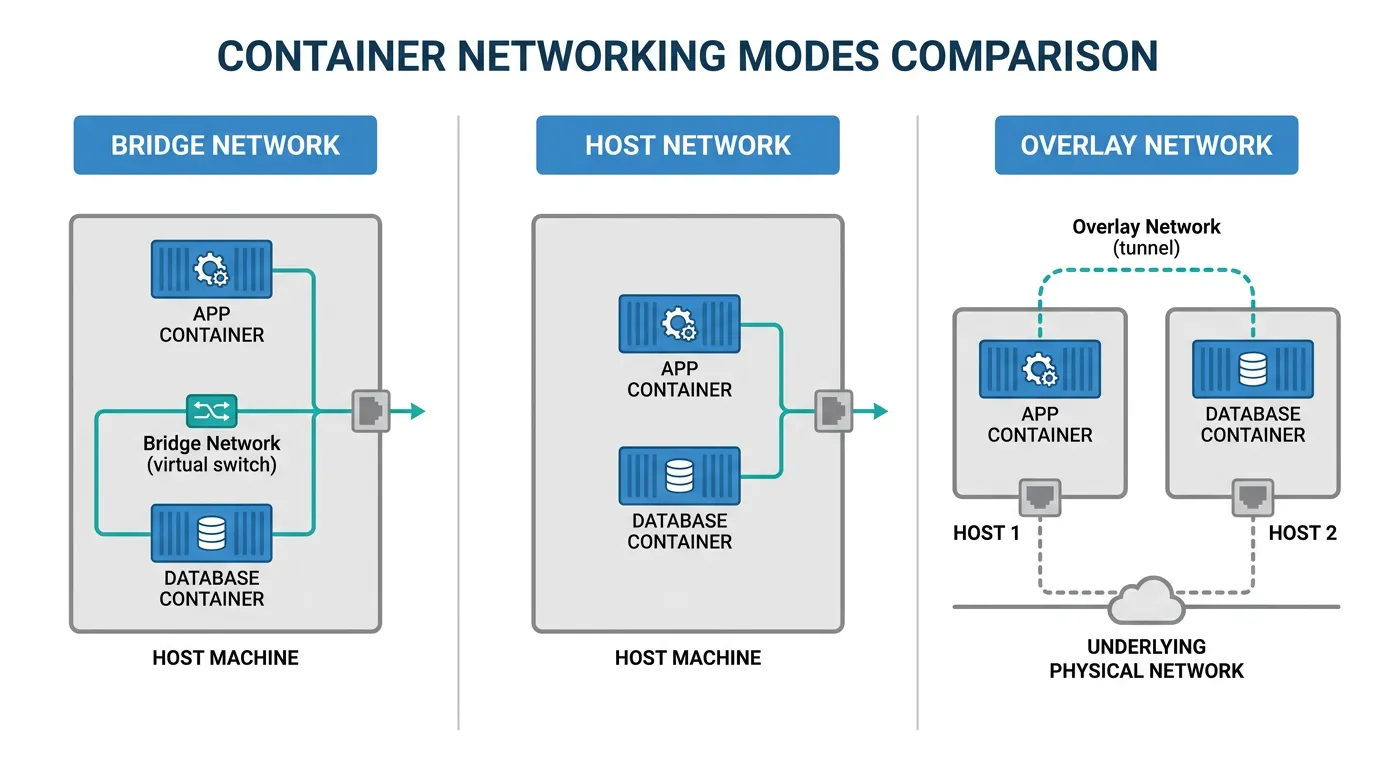
On Vercel, your app's networking is invisible — requests arrive, functions run, responses go out. Self-hosted, especially in containers, you're now making choices Vercel made for you: how your Next.js container talks to your database container, whether traffic between services stays inside a private network, how DNS resolution works between pods.
Get this wrong and you'll see symptoms that look like application bugs but are actually networking — connection timeouts under load, services that can reach each other locally but not in production, or traffic silently leaving your cluster when it shouldn't. If your team hasn't had to reason about this before, choosing a container networking mode explains the tradeoffs between bridge, host, and overlay networking in plain terms before you commit to one.
Building This Yourself vs. Not Having To
This is where most teams underestimate the cost of leaving Vercel: it isn't the migration, it's the ongoing operational surface. Metrics, tracing, and networking are each a real project — someone has to choose the tools, wire them together, and keep them running as the cluster changes. Kubo ships with monitoring and tracing wired into the cluster by default, so you're not assembling Prometheus and OpenTelemetry from scratch before you can even see what's happening in production.
That doesn't mean self-hosting is a mistake — plenty of teams have good reasons to do it, and doing it well is entirely possible. It means the decision to self-host should include an honest accounting of who owns observability afterward, not just who owns the deploy.
Where to Go From Here
If you're still deciding how much of this you want to run yourself versus how much you want a platform to handle, the underlying question is really about how much Kubernetes you want to operate directly. Compare K3s vs K8s for your team before picking a path — the answer changes depending on team size and how much on-call capacity you actually have.
If you'd rather skip assembling the monitoring stack yourself, Kubo runs standard Kubernetes with that layer already in place, with plans starting at ¥8,800/month for small projects and ¥17,600/month for most small teams. Either way, the goal is the same: know what you're taking on before an incident teaches you the hard way.